Every AI vendor promises an intelligent system. Very few will say which kind they are selling: a stateless wrapper around somebody else’s API, or an agent with write access to your production database. Both are marketed as AI. Only one of them can drop a table. Choosing between the different types of AI starts with knowing which one is on the invoice.
Every Singapore business deploying AI runs on the same kind of AI: Artificial Narrow Intelligence, not the science-fiction version. This guide maps the seven types of AI Singapore businesses actually use, from reactive machines to agentic systems, and the governance frameworks that the Infocomm Media Development Authority (IMDA), the Monetary Authority of Singapore (MAS), and the Personal Data Protection Commission (PDPC) expect organizations to work to before deployment.
The question for a Chief Technology Officer (CTO) or Chief Risk Officer (CRO) is not which type of AI is most advanced. It is which type fits the use case, and who is accountable for its decisions once it is live.
Key Takeaways
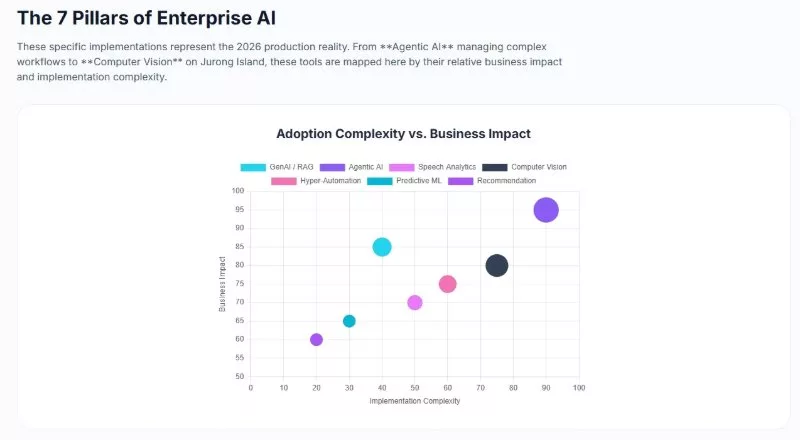
- Seven types are in production. Generative AI, agentic AI, NLP and speech analytics, computer vision, AI-driven hyper-automation, predictive analytics, and recommendation engines are the types Singapore enterprises deploy today.
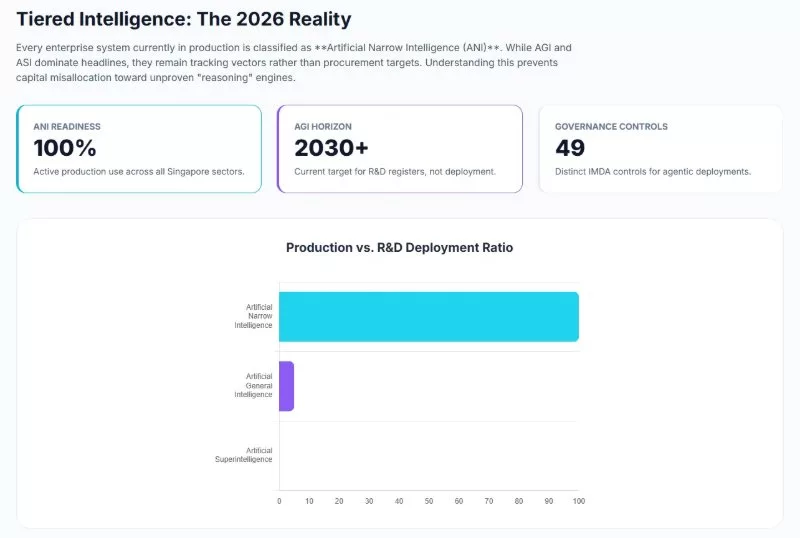
- Everything in production is Narrow AI. Every production AI system runs on Artificial Narrow Intelligence (ANI). Artificial General Intelligence (AGI) and Artificial Superintelligence (ASI) remain theoretical, and there is no agreed timeline for either.
- The IMDA agentic framework is voluntary, and specific. The IMDA Model AI Governance Framework for Agentic AI (Version 1.5, 20 May 2026) is non-binding and is organized around four dimensions: assess and bound risks upfront, make humans meaningfully accountable, implement technical controls and processes, and enable end-user responsibility.
- PDPA penalties are tiered. Breaching the Personal Data Protection Act (PDPA), including the Section 26 transfer limitation, can attract a penalty of up to 10% of annual Singapore turnover where turnover exceeds SGD 10 million, and up to SGD 1 million otherwise.
Table of Contents
Types of AI by Capability: The Three Tiers
Before mapping specific AI types to business use cases, CTOs and technology procurement leads need a clear view of what is production-deployable today and what belongs on an R&D watch list.
Tier 1:Artificial Narrow Intelligence (ANI): The Only Type Running in Production
Every AI system currently running in any Singapore enterprise falls under Artificial Narrow Intelligence. Whether it is an NLP engine parsing customer contracts, a computer vision model inspecting circuit boards, or a large language model generating compliance summaries: all of it is ANI. These systems are trained on domain-specific data to perform one bounded class of tasks. They cannot generalise knowledge to unrelated domains, adapt to entirely new problem types, or operate outside the boundaries of their training distribution.
Vinova engineers ANI systems to drive automated credit underwriting for financial institutions, real-time fraud detection pipelines, and industrial predictive maintenance programmes. The engineering priorities for ANI are: maximising inference throughput, minimising latency, controlling data drift, and implementing strict API boundary guardrails.
Tier 2: Artificial General Intelligence (AGI): A Watch-List Item, Not a Procurement Target
AGI is a theoretical class of machine intelligence capable of human-level planning, cross-domain reasoning, and adaptive autonomy without task-specific retraining. Expert timelines for AGI vary widely and there is no consensus on when, or whether, it will arrive. Today’s transformer-based models are powerful, but whether they can reach general intelligence is an open research question.
For Singapore enterprise technology leaders, AGI is an R&D tracking item. It is not a viable target for capital procurement or deployment budgets.
The Rule: if a vendor’s roadmap needs AGI to work, the product does not work yet.
Tier 3: Artificial Superintelligence (ASI): Theoretical, Not Imminent
ASI is a theoretical state in which machine intelligence exceeds collective human cognitive capability across all disciplines. It is a topic for long-range strategic discussion, not for a 2026 implementation roadmap.
Types of AI by Function: How Different Systems Preserve State
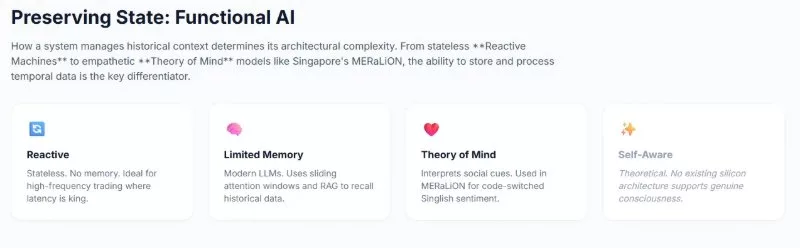
Beyond capability, enterprise architects need the four functional AI types, which describe how a system preserves state, manages historical context, and interacts with users. This classification is an informal taxonomy rather than a formal standard, but it is useful because it shapes integration architecture and compliance requirements.
1. Reactive Machines
Reactive machines are stateless: they hold no internal memory, retain no history, and calculate outputs solely from the current input. A reactive machine maps a specific input directly to an output without referencing past transactions. Static fraud-flagging rules and fixed rule-based filters are reactive systems.
Their value is determinism and low latency, which suits network routing and other pipelines where state is unnecessary and speed is critical. The limitation is structural: they cannot improve over time or adapt to changing input patterns.
2. Limited Memory AI
Limited Memory AI systems ingest and process historical data to adjust future predictions and outputs. Modern Large Language Models, deep neural networks, and predictive analytics engines fall here. LLMs work within a context window, the bounded amount of text they can consider in a single request.
To extend that memory across enterprise knowledge bases, engineers deploy Retrieval-Augmented Generation (RAG) pipelines: a vector database retrieves relevant content and passes it into the model’s context at inference time. Vinova uses this architecture for enterprise AI deployments where the knowledge base is dynamic, access-controlled, and too large to fit in a single context window.
3. Theory of Mind AI
Theory of Mind AI would model, interpret, and adapt to human emotional states, social cues, and psychological motivations, building a continuous picture of the user’s mental state. It remains a research goal.
Today’s closest commercial capability is emotion and intent recognition in speech. Singapore’s A*STAR MERaLiON (Multimodal Empathetic Reasoning and Learning in One Network) is one example: its second version covers English, Mandarin, Malay, Tamil, Singlish, Bahasa Indonesia, Thai, and Vietnamese, handles mixed-language speech, and detects emotional tone and other speech cues. Recognizing emotion in a voice is a step toward Theory of Mind AI, not an instance of it.
4. Self-Aware AI
Self-Aware AI is theoretical: a system with genuine consciousness, self-reflection, and independent volition. No current software architecture or hardware platform demonstrates self-awareness, and there is no evidence that today’s models are conscious. Any vendor claiming “self-aware software” in 2026 is making an unsupported claim. Current AI remains bounded by mathematical optimization.
Types of AI by Learning Method: Four Training Paradigms
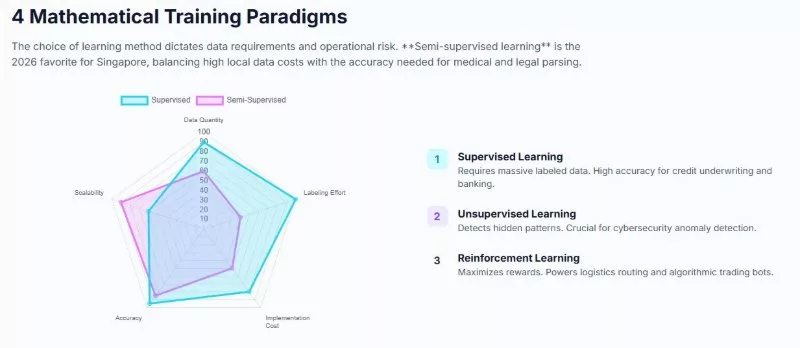
The way a model is trained determines its capabilities, limitations, and operational risks. Matching the use case to the right training paradigm is the first architecture decision, ahead of the model vendor or framework.
Supervised Learning
Supervised learning trains a model on labeled datasets, where each training instance pairs input features with a known correct output. The objective is to minimize prediction error across the training set. It is highly effective for classification and prediction tasks.
In Singapore’s banking sector, supervised models such as XGBoost, LightGBM, and CatBoost are used to assess creditworthiness and predict loan prepayment. The main operational challenge is the need for large, high-quality labeled datasets. Vinova keeps feature engineering and compliance design in Singapore, and where data preparation is done by its Vietnam delivery centers, access runs through Virtual Desktop Infrastructure (VDI) controls. VDI reduces exposure, but PDPA Section 26 compliance still depends on a legally enforceable arrangement that gives the data comparable protection.
Unsupervised Learning
Unsupervised learning works on unlabeled data to detect latent structure, cluster similar patterns, or reduce dimensionality without human labels. These systems analyze the statistical properties of the data directly and group records by similarity.
Enterprise deployments use clustering models such as k-means and Gaussian Mixture Models for market segmentation, and methods such as isolation forests for anomaly detection in security networks, while techniques like t-SNE help analysts visualize the results. Because they need no manual labeling, they scale well, but they need careful tuning so that the clusters they find line up with real business categories.
Reinforcement Learning
Reinforcement Learning (RL) trains an agent to choose sequences of actions in dynamic environments by maximizing a cumulative reward signal, adjusting its policy through trial and error. Modern enterprise deployments also combine RL with Reinforcement Learning from Human Feedback (RLHF) and Reinforcement Learning from AI Feedback (RLAIF) to align language models with corporate guidelines.
In industry, RL is used for supply chain routing and algorithmic trading. RL pipelines are sensitive to reward hacking: a model that finds an unintended shortcut to maximize its reward metric can cause real operational damage. That calls for strict runtime guardrails and simulated sandboxing before production rollout.
Semi-Supervised Learning
Semi-supervised learning bridges the two methods by training on a small set of high-quality labeled data together with a large pool of unlabeled data. Self-training techniques generate pseudo-labels for the unlabeled examples, and the model refines its decision boundaries iteratively.
This paradigm is relevant for Singapore enterprises facing high local data-acquisition costs. A small, locally audited, PDPA-compliant dataset seeds the model, and unlabeled data expands its training footprint, which can reduce labeling cost for use cases such as medical diagnostics and localized document parsing. Vinova structures these pipelines with the labeled seed data staying onshore under Singapore data governance.
The 7 Types of AI Deployed in Singapore Enterprises in 2026
The three classification frameworks above define the boundaries. These are the seven specific types of AI that Singapore enterprises deploy, and what each one needs to operate compliantly:
1. Generative AI and Large Language Models
Generative AI has matured from open-ended text generation into structured, API-driven components inside enterprise architectures. Modern enterprise RAG systems use LLMs as context-aware reasoning engines that parse unstructured documents, identify semantic patterns, and output structured payloads for downstream enterprise services.
In Singapore, these systems must handle regional linguistic complexity. General-purpose models can underperform on Singlish, regional languages, and code-switched dialogue. Vinova integrates SEA-LION (Southeast Asian Languages in One Network), the open model family from AI Singapore, where regional coverage matters. The Qwen-SEA-LION-v4 release supports English and seven Southeast Asian languages (Burmese, Filipino, Indonesian, Malay, Tamil, Thai, and Vietnamese) with a native 256K-token context window, and quantized versions allow lighter deployment on in-country cloud infrastructure. A newer v4.5 release is available.
Vinova in practice: rather than a prompt wrapper, Vinova engineers multi-layered RAG on vector stores (pgvector on Amazon Aurora PostgreSQL, Qdrant, or Pinecone) with isolated schemas and role-based access control (RBAC), so the model is grounded on a dynamic knowledge base without leaking one tenant’s documents into another’s answers. Quantized SEA-LION builds run on in-country Amazon Web Services (AWS) instances in ap-southeast-1, and every output carries automated retrieval-source citations plus an independent critique step that validates it against source ground truth before the user sees it. If a model answers from a shared index without schema isolation, one client’s contract clause becomes another client’s chatbot answer.
2. Agentic AI and Multi-Agent Systems
Agentic AI architectures use one or more autonomous agents capable of reasoning, multi-step planning, external API calls, and workflow execution without constant human prompting. An agent structurally combines a foundation model with instruction boundaries, memory, planning, tool-calling APIs, communication protocols, execution controls, and persistent audit logging.
When multiple agents interact, systemic risks arise: agent sprawl, conflict, miscoordination, and emergent behavior. Singapore organizations should align these deployments with the IMDA Model AI Governance Framework for Agentic AI (Version 1.5, May 2026). The framework is voluntary, and it recommends least-privilege tool access, human checkpoints for irreversible or high-stakes actions, and deterministic, rule-based controls in preference to prompt-layer instructions. Vinova’s standard architecture follows that last principle: agent execution is restricted through rule-based API policies, a structural boundary the agent cannot talk its way past.
Vinova in practice: Vinova designs state-preserving, multi-step agent workflows with LangGraph and CrewAI, and connects them to core business data and tool APIs through the Model Context Protocol (MCP). Three controls ship with every agent:
- Override-rate tracking: Vinova measures reviewer override rates, because an approval rate near 100% means rubber-stamping, not oversight.
- API allowlists: agents receive write privileges and external call rights only through strict allowlists.
- Human checkpoints: irreversible or high-stakes actions, such as financial disbursements or database drops, wait for human approval before they execute.
3. Natural Language Processing and Speech Analytics
Modern NLP and speech analytics engines process multilingual, code-switched dialogue in real time. In Singapore, customer-facing interfaces need to handle Singlish alongside English, Mandarin, Malay, and Tamil. A*STAR’s MERaLiON models are built for this setting, combining speech recognition with language understanding across mixed-language speech.
Applications include compliance monitoring in financial contact centers, customer satisfaction analytics, and localized public-sector services. For MAS-regulated institutions, deployments must be designed around MAS requirements, including the 1-hour notification window for a reportable incident, comprehensive audit logging, and preserved audit rights.
Vinova in practice: Vinova builds real-time multilingual speech and conversational pipelines for localized contact centers, integrating MERaLiON to parse mixed English, Singlish, Mandarin, Malay, Tamil, and Vietnamese speech and combining speech-to-text with tone and intent detection. For financial institutions and public sector bodies, continuous audit trails are engineered against the incident clocks and data retention requirements of the MAS Technology Risk Management (TRM) guidelines.
4. Advanced Computer Vision and Industrial Inspection
Computer vision uses convolutional neural networks (CNNs) and Vision Transformers (ViTs) to process visual data at high frequency. In manufacturing, maritime, and healthcare settings, these models often run on edge devices to reduce latency and keep data on site.
A clear Singapore example is uSINE, developed at KK Women’s and Children’s Hospital: an AI-powered, ultrasound-guided system that identifies spinal landmarks automatically to improve the success of spinal anesthesia during childbirth. KKH reports the following first-attempt success rates, with clinical use since May 2023.
Table 1: uSINE First-Attempt Spinal Anesthesia Success Rates (KK Women’s and Children’s Hospital)
| Patient Group | Conventional Manual Method | With uSINE |
|---|---|---|
| Women of healthy weight | 70% | 92% |
| Obese women | 43% | 82% |
Vinova in practice: Vinova deploys CNNs and ViTs for high-frequency optical quality control, document image analysis, and industrial inspection, then quantizes the models to run on low-power, on-premise edge hardware. The payoff is latency and privacy: sensitive feeds, such as patient diagnostics or a proprietary production line, never transit a cloud. If raw feeds leave the premises, the compliance question stops being about the model and starts being about the network. Where custom training is economically inefficient, Vinova embeds managed perception services (Amazon Rekognition, Google Cloud Vision) instead, which cuts upfront capital.
5. Robotic Process Automation and AI-Driven Hyper-Automation
Technology leaders need to distinguish legacy script-based RPA from AI-driven hyper-automation. Legacy RPA scripts replicate simple, deterministic human actions such as copying structured data or clicking fixed screen coordinates. They are fragile: a minor interface change or an unexpected input format breaks execution.
AI-driven hyper-automation adds cognitive capability: computer vision locates interface elements dynamically, LLMs parse and categorize unstructured email attachments, and RL models optimize process routing. To modernize legacy automation, Vinova applies the Strangler Fig Pattern: cloud-native microservices are built around the existing monolith and replace its components incrementally, with traffic routing shifted gradually so that users see minimal disruption. We have applied this approach on a global maritime shipping group’s Enterprise Resource Planning (ERP) system and on a Singapore energy utility group’s digital platform.
Vinova in practice: adaptive pipelines replace coordinate-based RPA scripts. Computer vision parses interfaces that change underneath the bot, and LLMs extract semi-structured data from PDFs, emails, and invoices. Anything the pipeline cannot parse with confidence falls back to a manual queue instead of failing silently.
6. Predictive Analytics and Machine Learning Pipelines
Predictive analytics systems apply supervised and semi-supervised learning to structured enterprise data to forecast outcomes. In Singapore’s financial sector, these models assess creditworthiness and predict loan prepayment. In healthcare, they support diagnostic imaging interpretation and clinical workflow prioritization. In manufacturing, they generate predictive maintenance schedules from Internet of Things (IoT) sensor data.
The operational risk in all three settings is data drift: the model’s training distribution diverges from real-world inputs over time, and accuracy degrades. Vinova’s AI deployment standard includes automated drift monitoring in production continuous integration and continuous delivery (CI/CD) pipelines, so that retraining is triggered before degraded accuracy reaches customer-facing decisions.
Vinova in practice: a model is only as good as the pipes feeding it. Vinova uses AWS Glue for extract, transform, load (ETL) and integrates Apache Kafka, Debezium for Change Data Capture (CDC), Apache Airflow, and dbt to deliver schema-standardized data from legacy transactional databases into predictive models. If that data is not validated first, the model learns the legacy system’s quirks as if they were signal.
7. Recommendation Engines and Personalisation Systems
Recommendation engines use collaborative filtering, content-based filtering, and hybrid approaches to surface relevant products, content, and services from user behavior. In Singapore retail and e-commerce, they power personalized content and route customer service interactions by intent.
PDPA consent and notification obligations govern how behavioral data is collected, stored, and used in these systems. Vinova structures recommendation deployments around data minimization: collect only the data the recommendation function needs, retain it only as long as the purpose requires, and confirm the consent or applicable PDPA exception for each data category before the system goes live. Organizations that get this right avoid PDPC enforcement and also build customer trust.
Vinova in practice: Vinova builds hybrid engines that combine collaborative filtering, content-based algorithms, and unsupervised clustering (k-means, Gaussian Mixture Models) on enterprise backends such as Odoo and custom headless architectures. Behavioral tracking is limited to the attributes the scoring needs, and post-hoc explainability methods, SHapley Additive exPlanations (SHAP) and Local Interpretable Model-agnostic Explanations (LIME), let a reviewer audit why a visitor saw a given recommendation.
Practitioner Verdict: start with the cheapest method that can be audited. Reach for deep learning only when the data is unstructured and the rule-based and traditional ML options have visibly run out.
Execution Strategy: The AI-Assisted Engineering Advantage
These different types of AI map differently across Singapore’s main vertical markets. The table below shows which AI types power which sectors, the regulatory references that apply, and the key delivery challenge in each.
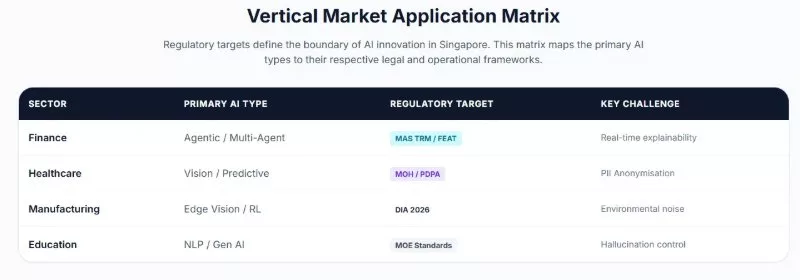
Table 2: AI Types, Regulatory References, and Delivery Challenges by Sector
| Sector | Primary AI Type | Operational Use Case | Regulatory Reference | Key Delivery Challenge |
|---|---|---|---|---|
| Finance | Agentic AI and multi-agent systems | Real-time transaction monitoring, fraud triage, credit underwriting support, compliance report generation | MAS TRM Guidelines, MAS Fairness, Ethics, Accountability, and Transparency (FEAT) Principles, MAS AI Risk Management Toolkit (non-binding) | Preventing multi-agent miscoordination; real-time explainability |
| Healthcare | Computer vision and predictive analytics | Medical image analysis (for example SELENA+ retinal screening), clinical workflow prioritization | Ministry of Health (MOH) and Health Sciences Authority (HSA) AI in Healthcare Guidelines (AIHGle 2.0), PDPA | Low-latency edge processing; strict de-identification of patient data |
| Retail and E-commerce | Generative AI and recommendation engines | Personalized content generation, localized customer service routing | PDPA consent and notification obligations | Managing model drift in interaction logs; context window limits |
| Manufacturing | Edge computer vision and reinforcement learning | Optical quality inspection, robotic asset positioning, predictive maintenance | PDPA; Cybersecurity Act 2018 where operations are designated critical information infrastructure | Running complex models on low-power edge hardware; noisy physical environments |
| Logistics | Reinforcement learning and hyper-automation | Route optimization, automated warehouse inventory dispatch | PDPA | State-space complexity in dense urban routes; continuous retraining |
| Education | NLP and generative AI | Personalized learning content, automated grading workflows, language tutoring | PDPA (student data) | Hallucinations in academic reference data; separating student identity data |
For the financial sector, MAS announced the AI Risk Management Toolkit on 20 March 2026 as the output of the second phase of Project MindForge, an MAS-led industry initiative. Its centerpiece is the AI Risk Management Operationalisation Handbook, which covers traditional, generative, and agentic AI. The toolkit is a set of resources aligned with MAS’s proposed Guidelines on AI Risk Management, which were still under review when the toolkit was announced. It is guidance, not a binding rule. Our delivery for regulated financial institutions, including a Singapore financial markets operator, a retail bank, and a life insurer, informs how we build AI governance into financial-sector systems.
Vinova’s Client AI Building Matrix: What We Build and How We Control It
The seven categories above are not slideware. Here is how each one gets built, what it is used for, and which control ships with it.
Table 3: Vinova Client AI Building Matrix by AI Type
| AI Type Deployed | Core Architecture and Tech Stack | Primary Client Use Case | Governance and Risk Controls Applied |
|---|---|---|---|
| Generative AI and LLMs | RAG, pgvector on Aurora PostgreSQL, SEA-LION, Claude and GPT APIs | Enterprise knowledge retrieval, automated contract and report drafting | Retrieval citations, PII tokenization gateways, zero-retention cloud agreements |
| Agentic AI | LangGraph, CrewAI, MCP, Docker sandboxes | Multi-step workflow orchestration, automated triage and API task execution | IMDA Agentic AI Framework v1.5, API allowlists, human-in-the-loop checkpoints |
| NLP and speech analytics | A*STAR MERaLiON, Amazon Comprehend, custom NLP engines | Multilingual and Singlish customer service, contact-center compliance monitoring | Localized data isolation, encrypted audio logging, MAS TRM alignment |
| Computer vision | CNNs, ViTs, Amazon Rekognition, Google Cloud Vision | Edge-based optical quality control, learning-platform content verification | Edge model quantization, on-premise inference with no cloud transit of raw feeds |
| AI hyper-automation | Strangler Fig Pattern, microservices, document parsers, optical character recognition (OCR) and LLMs | Automated invoice processing, ERP document ingest | Automated fallback to manual queues, legacy monolith decoupling |
| Predictive analytics | XGBoost, LightGBM, AWS Glue, Kafka, Debezium, dbt | Facilities predictive maintenance, creditworthiness scoring, churn prediction | Automated data drift monitoring, glass-box explainability (SHAP and LIME) |
| Recommendation engines | Unsupervised clustering, collaborative filtering, Odoo Enterprise | Visitor booking ecosystems, e-commerce cross-selling | Data minimization, PDPA purpose notification and consent compliance |
Responsible AI Deployment: Five Governance Risks Every Singapore Business Must Address
Deploying any of the different types of AI above without a structured risk governance framework creates financial, legal, and reputational exposure. IMDA publishes voluntary governance frameworks, MAS supervises financial institutions, and the PDPC enforces the PDPA, so a single AI system can answer to all three.
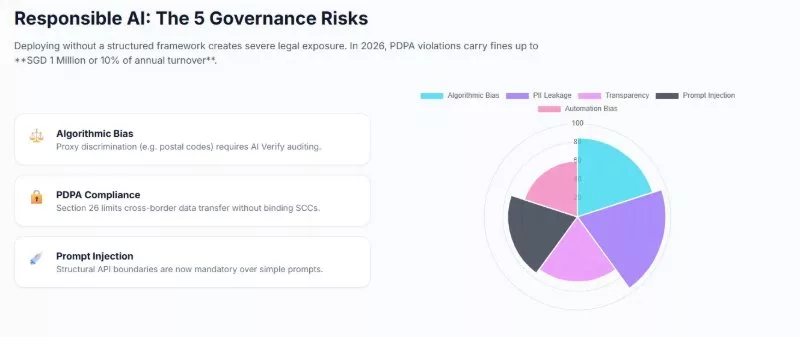
1. Algorithmic Bias and Proxy Discrimination
AI models produce discriminatory outputs when their training data contains human prejudice or structural inequality. Even after direct demographic indicators are removed, models can latch onto proxy variables: postal codes that correlate with socioeconomic status, or transaction patterns that correlate with protected characteristics.
MAS’s FEAT principles and IMDA’s AI Verify testing framework give Singapore organizations a structured way to test for fairness, including measures such as disparate impact ratios on historical predictions. Both are voluntary, and both are the reference points regulators and customers increasingly expect. Vinova applies pre-deployment fairness checks and debiasing techniques to models that affect customer-facing decisions, and builds AI Verify-based evaluation into CI/CD pipelines where the client adopts it.
2. PDPA Data Breach and Cross-Border Transfer Exposure
Using global cloud APIs for AI training or inference creates a data leakage risk. Under PDPA Section 26, personal data transferred outside Singapore must receive a standard of protection comparable to the PDPA, which organizations typically secure through a legally enforceable arrangement such as contractual clauses (the ASEAN Model Contractual Clauses (MCCs) are one option). Breaches of the PDPA can attract a penalty of up to 10% of annual Singapore turnover where turnover exceeds SGD 10 million, and up to SGD 1 million otherwise.
Vinova’s standard data architecture for AI deployments has four layers: on-premise or private cloud storage for personally identifiable information (PII); an enterprise API gateway that scrubs PII in real time and replaces real identifiers with tokens (Microsoft Presidio is one such engine) before any payload reaches an external model; an in-country cloud tier (for example AWS ap-southeast-1, the Singapore region) for inference and storage; and Data Processing Agreements with zero-retention terms executed before any AI tool enters a client production environment. Development squads in Vietnam reach code and test environments only through VDI, working with synthetic or anonymized datasets under the ASEAN MCCs.
3. Model Transparency, Hallucinations, and the Black Box Problem
Deep learning models are not directly interpretable. Their decisions come from multi-layered weight matrices rather than explicit rules, which makes it hard to explain why a model rejected a credit application or made a diagnostic recommendation. Generative models add a second problem: they can produce confident but factually incorrect output, and because they sample, outputs can vary between runs.
Vinova’s standard architecture for high-stakes deployments moves beyond simple prompt wrappers to multi-layered RAG with retrieval-source citation, paired with independent critique steps that check outputs before they reach the user. For customer-facing decisions where transparency matters, we use post-hoc explainability methods such as SHAP or LIME to identify the input variables driving each decision and to generate human-readable rationales.
Human alignment at scale: Vinova operates a dedicated 40-member AI Evaluation Squad trained in RLHF. The squad benchmarks domain-specific prompts, evaluates edge cases, flags hallucinations, and red-teams LLMs before enterprise deployment. If nobody red-teams the model before launch, your customers will do it for you.
4. Prompt Injection and Model Hijacking
Attackers craft inputs containing hidden instructions that bypass system constraints and hijack the model’s reasoning. For autonomous agents the risk is severe: an injected payload can compromise the execution loop, causing the agent to run unauthorized commands, exfiltrate database contents, or issue malicious API requests.
The technical-controls dimension of the IMDA Agentic AI Framework (Version 1.5) recommends structural, rule-based controls over prompt-layer instructions, along with runtime controls such as input validation and rate limits, and sandboxed execution. Vinova applies these through database write-privilege restrictions and API routing allowlists rather than natural-language guidelines, input validation before model processing, and sandboxed container isolation (Docker or gVisor) for any agent that can generate or execute code. The boundary is architectural. A well-crafted prompt cannot talk its way past it.
5. Automation Bias and Workforce Skill Degradation
As AI agents take on complex analytical and operational tasks, automation bias sets in: human reviewers defer to algorithmic recommendations without critical evaluation, and the skills needed to run processes manually during a system failure erode. If the agent goes offline, the organization may no longer know how to continue.
The IMDA agentic framework addresses this directly. It recommends tracking human override rates and response times, training reviewers on agentic failure modes, placing human checkpoints on irreversible or high-stakes actions, and treating the erosion of basic operational skills as a business continuity risk. A near-100% approval rate on agent recommendations is a warning sign of rubber-stamping, not evidence of good oversight. On the skills side, IMDA’s National AI Impact Programme, announced at the Committee of Supply 2026, is a support program that aims to help 10,000 enterprises adopt AI and develop 100,000 workers into AI-bilingual professionals over three years. Scheduled outage simulations that keep a manual fallback working complete the picture.
Vinova’s Responsible AI Architecture: Five Layers, Not One Policy Document
The five risks above are handled by layers in the stack, not by a policy document in a shared drive.
Table 4: Vinova Responsible AI Architecture by Layer
| Architecture Layer | Vinova Standard Component |
|---|---|
| Data ingestion | AWS Glue, Apache Kafka, and Debezium: decoupled ETL and event streams |
| Privacy gateway | PII scrubbing and anonymization engine (Microsoft Presidio) |
| Inference tier | AWS Singapore (ap-southeast-1) or dedicated on-premise edge hardware |
| AI safety and QA | AI Verify, Project Moonshot, 40-member human RLHF squad |
| Legal and contract | PDPA Section 26, ASEAN MCCs, Singapore International Arbitration Centre (SIAC) Master Services Agreements |
Regulatory verification: as an AI Verify Foundation member, Vinova runs the open-source AI Verify toolkit from IMDA and Project Moonshot inside CI/CD pipelines, testing models for fairness, demographic parity, explainability, and adversarial robustness before release.
| Deploy AI in Your Business with Vinova Book a complimentary 2-hour AI architecture consultation with Vinova’s Singapore-based team. We will map the right AI approach to your business context, assess your PDPA and IMDA governance posture, and design a production-grade delivery plan. No commitment required. Schedule Your Free 2-Hour AI Strategy Consultation with Vinova |
Types of AI FAQ
What is the fundamental difference between a generative AI wrapper and an enterprise-grade agentic AI application?
A generative AI wrapper is a stateless interface that sends a user query to an external model API and returns the response. It keeps no state, calls no external tools, and depends entirely on prompt quality. Wrappers are the most common first deployment of AI in business, and often the most disappointing, because they struggle under real enterprise data volumes and integration requirements.
An enterprise-grade agentic AI application is a state-preserving, multi-layered system capable of planning, tool execution, and multi-step reasoning across sessions. It combines a foundation model with instruction boundaries, memory stores, and secure integration layers, often using MCP to call enterprise APIs and query databases. It operates under deterministic system-level controls, with audit logging and sandboxed execution. The distinction is not sophistication. It is the difference between a demo and a production system.
How does the IMDA Model AI Governance Framework for Agentic AI (Version 1.5, May 2026) affect software development for Singapore businesses?
The framework is voluntary, but it sets out what responsible agentic AI development looks like. It is organized around four dimensions: assess and bound risks upfront, make humans meaningfully accountable, implement technical controls and processes, and enable end-user responsibility. Version 1.5 extends the risk taxonomy to cover agent sprawl and multi-agent failures such as miscoordination and conflict, adds practical measures against automation bias such as tracking override rates, prefers structural, rule-based controls over prompt-layer controls, and adds change management guidance. For development teams, that means scoping an agent’s tool access and autonomy before building, testing the whole workflow rather than only the model, and designing checkpoints and fallbacks into the system from the start.
What type of AI do modern Large Language Models like GPT or Claude actually fall under?
Modern Large Language Models are among the most capable types of AI, but they remain Artificial Narrow Intelligence (ANI) from a capability perspective and Limited Memory AI from a functional perspective. Despite their fluency, code generation, and multi-step reasoning, they are not general intelligences: they do not act with independent volition, and they do not reliably generalize across unrelated domains.
They are sequence prediction models built on self-attention, and their operation is bounded by training, prompt instructions, and context window limits. That places them within ANI, however capable their output appears.
How can a Singapore business reduce algorithmic bias risk in machine learning models?
Bias cannot be eliminated outright, but it can be managed through a continuous, programmatic workflow across the model lifecycle:
- Define explicit fairness metrics: demographic parity, equalized odds, or disparate impact ratios for every model that affects customer outcomes.
- Use a structured testing framework: IMDA’s AI Verify supports repeatable evaluation and documentation of model performance, and can be run in CI/CD pipelines.
- Apply debiasing techniques: pre-processing (re-weighting training data), in-processing (adversarial training so the model cannot identify protected attributes), and post-processing (calibrating decision thresholds across cohorts).
- Audit proxy variables regularly: run sensitivity analyses to find and remove variables, such as postal codes, that correlate with protected attributes, and document each step against MAS FEAT and PDPA requirements.
What cloud architecture and database stack is recommended to scale AI applications securely under the PDPA?
- Frontend: React, Vue.js, or mobile-native frameworks with strict client-side validation and Content Security Policies (CSP) to reduce cross-site scripting risk.
- Database: pgvector on Amazon Aurora PostgreSQL, Qdrant, or Pinecone for vector storage, with role-based access control and isolated logical schemas to prevent cross-tenant data access.
- In-country cloud: AWS ap-southeast-1 or a hybrid private cloud for inference and data storage within Singapore, which avoids cross-border transfer questions under PDPA Section 26 for that data.
- API security: PII anonymization services (such as Microsoft Presidio or custom pattern-matching engines) upstream of all external AI models, replacing real identifiers with tokens before any payload reaches an external endpoint, plus complete encrypted logging on local servers for PDPC auditability.
Deploying the Right Types of AI: Accountability Before Launch
From reactive machines processing simple inputs to agentic systems executing autonomous workflows, the seven types of AI Singapore enterprises deploy all sit within one boundary: Artificial Narrow Intelligence, not the general reasoning of AGI or the theoretical reach of ASI. Choosing the right type, and pairing it with the right governance framework, is what separates a compliant, production-grade deployment from a costly compliance gap. Vinova’s approach is built around that accountability:
- Fiduciary Governance & Regulatory Alignment: Delivery operations certified under ISO/IEC 27001:2022 (Information Security) and ISO 9001:2015 (Quality Management) and GovTech Category 1B approved, with delivery designed to align with PDPA, GovTech Instruction Manual 8 (IM8), and MAS TRM requirements. Vinova is also a member of the AI Verify Foundation.
- Singapore Corporate Governance: Master Services Agreements governed under Singapore law with SIAC arbitration, so intellectual property (IP) ownership, audit rights, and accountability are defined before the first sprint.
- Governed AI Delivery Practice: a suitability check on the use case first, rule-based controls around every agent and model, drift and fairness monitoring in production, and human checkpoints on high-stakes decisions.
- Engineering Depth: 300+ in-house engineers across Singapore and Vietnam delivery hubs in Ho Chi Minh City, Da Nang, and Hanoi, with 8% to 12% annual voluntary attrition, so the people who build your system are still there to run it.
Explore Vinova’s AI and custom software development services, or talk to our team about the right AI approach for your business.
| Vinova: a Singaporean Government-Grade Digital Transformation Partner, Made Accessible. For 16 years, we have designed digital systems for 300+ companies and government agencies worldwide, backed by ISO 27001:2022 and ISO 9001:2015 certification and Singapore GovTech Category 1B approval. 300+ employees across offices in Singapore, Vietnam (Hanoi, Da Nang, Ho Chi Minh City), Norway (Oslo), and Thailand (Bangkok), scaling platforms and engineering capacity to serve clients across the globe. Financial Times Top 500 High-Growth Companies Asia-Pacific 2026. Recognized among Singapore’s Top 100 Fastest-Growing Companies in 2024, 2025, and 2026. Contact Vinova for an AI Governance Assessment → |