Why are users abandoning apps with static displays? Modern mobile applications must deliver dynamic, interactive experiences with data updated in milliseconds. Real-time charts meet this demand, transforming live data streams from financial markets or IoT sensors into instantly clear visual narratives.
This guide details building such features using Firebase and Chart.js. It addresses integration across frameworks like Ionic, React Native, and Flutter, where Chart.js, a JavaScript library, may require wrappers for native environments, impacting rendering and interaction logic.
Table of Contents
Implementing Real-Time Data Flow: Firebase to Chart.js
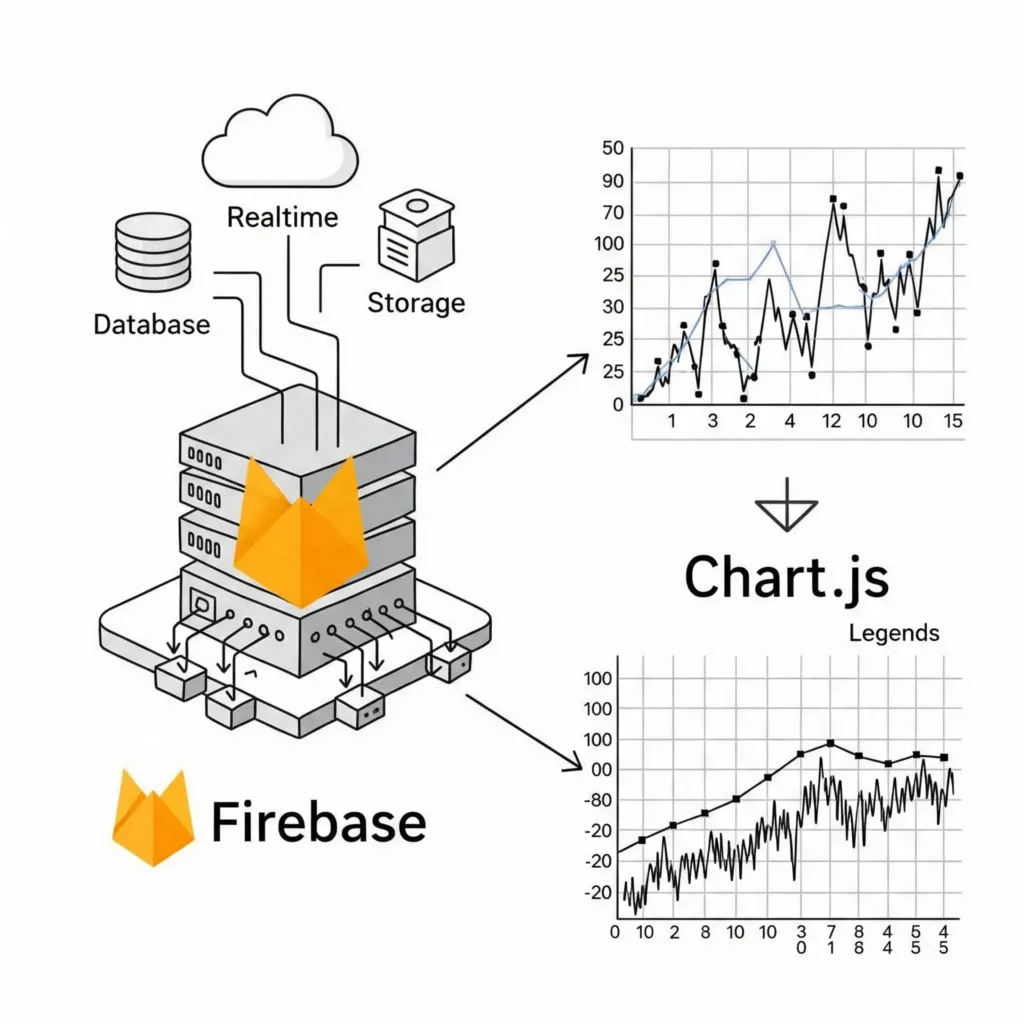
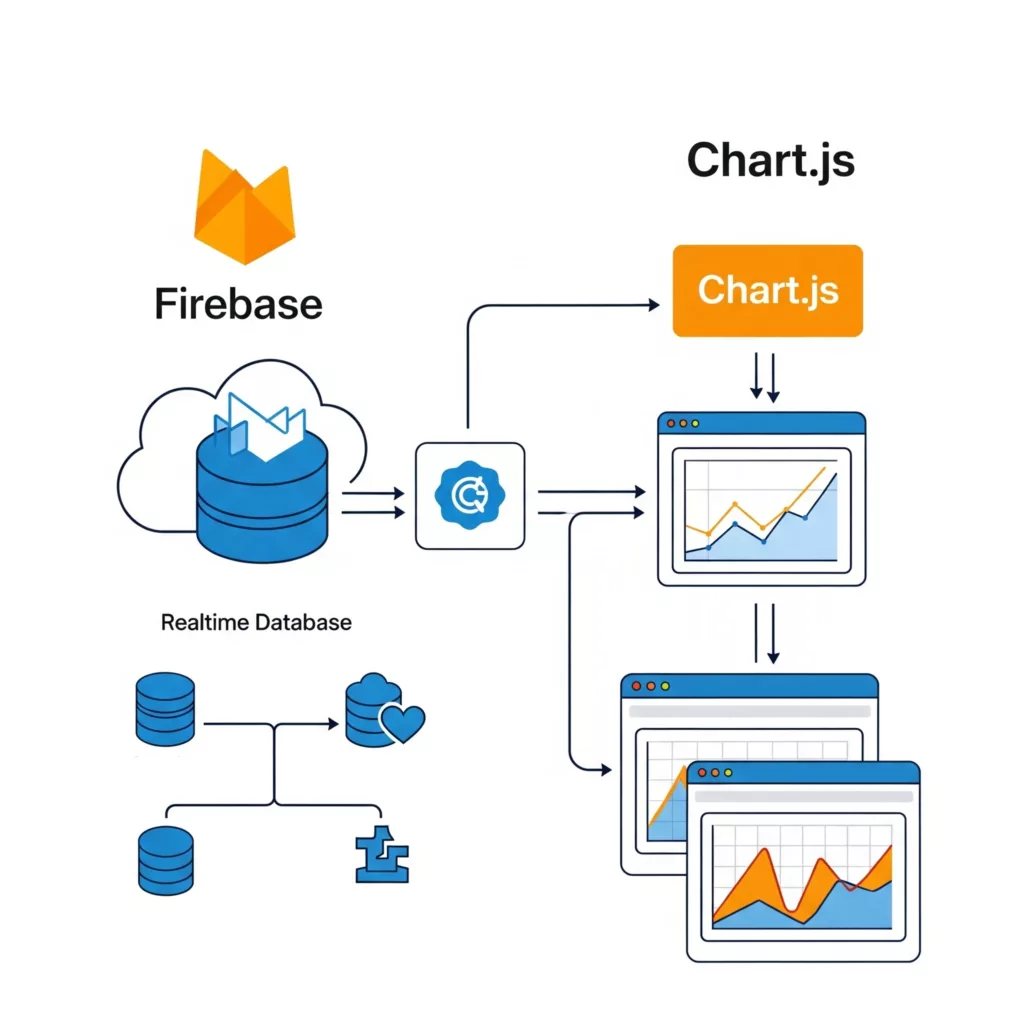
Real-time charting depends on the seamless flow of data from Firebase to Chart.js. This process involves listening for Firebase data changes, transforming this data for Chart.js, and dynamically updating the chart instance.
Listening for Data Changes in Firebase
Both Firebase Realtime Database (RTDB) and Cloud Firestore enable subscriptions to real-time data changes.
Firebase Realtime Database (RTDB): The on() method (or onValue() in the modular Firebase SDK v9+) listens for data changes at a specific JSON tree path. When data at this path or its children changes, the callback function executes with a snapshot of the current data.
Cloud Firestore: Firestore’s onSnapshot() method listens for changes to a document or query results. The initial call provides the current state; subsequent calls fire when data changes. snapshot.docChanges() provides an array detailing documents added, modified, or removed since the last snapshot, allowing for granular updates.
Transforming Firebase Data for Chart.js
Data from Firebase (JSON objects from RTDB or Firestore document data) rarely matches the structure Chart.js requires for its labels and datasets arrays. Transformation is nearly always necessary. For instance, if Firebase stores time-series data as [{timestamp: T1, value: V1}, {timestamp: T2, value: V2}], timestamps (T1, T2) might become the labels array, and values (V1, V2) would form the data array within a dataset.
Dynamically Updating Chart.js
After receiving and transforming Firebase data, update the Chart.js instance using chart.update(mode).
The workflow:
- The Firebase listener receives new data.
- Raw data is transformed for Chart.js (e.g., updated labels and datasets[i].data arrays).
- The chart instance’s chart.data.labels and chart.data.datasets[i].data properties are modified.
- myChart.update(); re-renders the chart.
The mode parameter for chart.update(mode) can influence performance. For instance, chart.update(‘none’) updates without animations, beneficial for high-frequency updates.
The efficiency of real-time updates depends on Firebase listener structure and Chart.js update application. Naive implementations, like re-fetching entire collections or full chart redraws for minor changes, degrade performance. Utilizing Firestore’s docChanges() for delta updates and chart.update(‘none’) for high-frequency data streams without animation is more efficient. Consider the “granularity of change” in data models and chart display to optimize the update pipeline.
Meticulous management of listener subscriptions is necessary. Firebase listeners (onValue() for RTDB, onSnapshot() for Firestore) create persistent connections. If a UI component initiating a listener is removed without detaching it, the listener continues running, consuming resources and potentially causing errors. Invoke cleanup functions (e.g., the function returned by onSnapshot(), or RTDB’s off() method) within appropriate mobile framework lifecycle methods (like componentWillUnmount in React, ngOnDestroy in Angular, or dispose in Flutter widgets) to prevent memory leaks and manage resources efficiently.
Building Real-Time Charts: Framework-Specific Tutorials
Core concepts of Firebase and Chart.js integration are consistent, yet implementation details differ across mobile frameworks. This section offers guidance for Ionic (React/Angular), React Native, and Flutter, covering library installation, Firebase setup, chart component creation, real-time data connection, and chart updates, with illustrative code examples.
A quick reference for common Firebase and charting library installations:
| Framework | Firebase Plugin(s) / SDK | Charting Library/Wrapper | Key Installation Commands |
| Ionic (React) | firebase | chart.js, react-chartjs-2 | npm install firebase chart.js react-chartjs-2 |
| Ionic (Angular) | firebase, @angular/fire | chart.js, (optionally ng2-charts) | npm install firebase @angular/fire chart.js ng2-charts |
| React Native | @react-native-firebase/app, /firestore or /database | react-native-chart-kit, react-native-gifted-charts, WebView + Chart.js | npm install @react-native-firebase/app @react-native-firebase/firestore<br/>npm install react-native-svg react-native-gifted-charts |
| Flutter | firebase_core, cloud_firestore or firebase_database | fl_chart, charts_flutter, syncfusion_flutter_charts | flutter pub add firebase_core cloud_firestore fl_chart |
A. Ionic (with React/Angular)
Ionic applications, being web-based, can leverage Chart.js directly.
- Setup:
- Install Ionic CLI; create an Ionic React or Angular project.
- Install Firebase and Chart.js: npm install firebase chart.js.
- For Ionic React, install react-chartjs-2: npm install react-chartjs-2. This provides React components for Chart.js.
- For Ionic Angular, install @angular/fire: npm install @angular/fire (official Angular library for Firebase). ng2-charts is an optional Angular wrapper for Chart.js.
- Configure Firebase: Create a Firebase configuration file (e.g., src/firebaseConfig.ts) and initialize Firebase with credentials from the Firebase console.
- Ionic React Example Outline:
- Use Ionic React elements (IonPage, IonContent).
- Define a <canvas> or use react-chartjs-2 components (e.g., <Line data={chartData} options={chartOptions} />).
- Employ the useEffect hook for Chart.js initialization (if not using react-chartjs-2) and Firebase listeners (e.g., firebase.database().ref(‘path/data’).on(‘value’, snapshot => {…})).
- Manage chart data state with useState. Update state upon Firebase data arrival to trigger re-renders.
- Clean up Firebase listeners in the useEffect return function.
- Ionic Angular Example Outline:
- Create Angular components and services.
- Inject AngularFirestore or AngularFireDatabase from @angular/fire to interact with Firebase.
- Use @ViewChild to reference the <canvas> element.
- Initialize Chart.js in ngOnInit and subscribe to Firebase data observables.
- Update Chart.js instance data and call chart.update() on new data.
- Unsubscribe from Firebase observables in ngOnDestroy.
B. React Native
React Native’s native rendering requires a different approach.
- Setup:
- Install React Native CLI; create a new project.
- Install core React Native Firebase: npm install @react-native-firebase/app.
- Install specific service modules (e.g., npm install @react-native-firebase/firestore).
- Perform platform-specific setup (Android: google-services.json, build.gradle files; iOS: GoogleService-Info.plist, Podfile, AppDelegate modifications).
- Choose and install a charting library (e.g., react-native-gifted-charts, react-native-chart-kit) or use Chart.js within a WebView (adds complexity for real-time updates).
C. Flutter
Flutter’s reactive framework integrates well with Firebase and charting libraries.
- Setup:
- Install Flutter SDK; create a new project.
- Add Firebase plugins (firebase_core, cloud_firestore or firebase_database) to pubspec.yaml.
- Use FlutterFire CLI (dart pub global activate flutterfire_cli then flutterfire configure) to generate firebase_options.dart and configure native projects.
- Initialize Firebase in main.dart: WidgetsFlutterBinding.ensureInitialized(); await Firebase.initializeApp(options: DefaultFirebaseOptions.currentPlatform);.
- Choose and add a charting library (e.g., fl_chart, charts_flutter, syncfusion_flutter_charts) to pubspec.yaml.
The choice of charting library for React Native and Flutter involves trade-offs in ease of use, customization, performance, and community support. These libraries have distinct APIs for data input and updates. Evaluate them based on application requirements and integration ease with Firebase.
For React Native or Flutter, using native Firebase SDKs (@react-native-firebase, FlutterFire) provides more robust and performant integration than the Firebase JavaScript SDK in a WebView. Native SDK wrappers leverage platform capabilities for background sync, offline persistence, and efficient networking, generally preferred for demanding real-time applications.
Performance Optimization Strategies
Smooth, responsive real-time charting demands diligent performance optimization across the entire data pipeline, from Firebase data retrieval and transmission to client-side processing and Chart.js rendering.
Optimizing Firebase Data Retrieval
- Cloud Firestore:
- Efficient Queries: Construct specific queries. Use filters (where()) to narrow datasets and limit() to fetch only necessary documents for the current chart view. Avoid fetching entire collections if a subset suffices.
- Indexing: Ensure common query patterns, especially those with multiple where() clauses or orderBy() on different fields, are supported by appropriate composite indexes. Firestore often suggests these, but review and create them proactively. Regularly audit and remove unused indexes to avoid unnecessary write overhead and storage costs.
- Pagination: For historical data charts, implement pagination (e.g., using startAfter() and limit()) to load data in manageable chunks, rather than all historical points at once.
- Real-time Updates with docChanges(): With onSnapshot listeners, leverage querySnapshot.docChanges() to process only documents added, modified, or removed since the last snapshot. This is more efficient than re-evaluating the entire dataset.
- Caching and Offline Persistence: Firestore SDKs automatically provide offline persistence, caching data locally. This reduces redundant reads and allows offline app function. For infrequently changing but often accessed data, consider an additional application-level cache.
- Firebase Realtime Database:
- Shallow Data Structures: Keep data structures as flat as possible. This allows listeners to subscribe to more specific data paths, avoiding the download of large, irrelevant data branches.
- Keep Payloads Small: Structure data so listeners receive only fields essential for the chart. Avoid including large text or binary data in nodes frequently listened to for chart updates.
- Limit Listener Scope: Attach listeners to the most granular path providing the necessary data. Specific paths mean less data transferred and processed on each update.
Efficient Chart.js Updates
Chart.js update methods significantly impact rendering performance, especially with high-frequency updates.
| Technique | Description | Use Case/Benefit for Real-Time Charts |
| chart.update(‘none’) | Updates chart without animations if only data points change, not chart structure or options. | Crucial for high-frequency data updates to prevent lag. |
| chart.render() | Redraws chart without layout recalculations if only visual aspects change (not data/scales). | Faster than update() if no data or scale changes occurred. |
| requestAnimationFrame() | Batches multiple update calls into a single browser frame. | Smooths out rapid updates (e.g., from streaming data or user interactions like zoom/pan). |
| Debouncing/Throttling | Limits update call frequency for high-frequency events (mouse move, scroll, rapid data stream). | Prevents overwhelming the browser with too many chart updates quickly. |
| Toggle Dataset Visibility | Hide/show datasets (getDatasetMeta(index).hidden = true/false) instead of removing/adding. | Less expensive than full data manipulation for large datasets if series just need toggling. |
| Decimation Plugin | Reduces data points rendered for large datasets while preserving visual trends. | Improves rendering performance significantly for charts with thousands of points. |
| Direct Data Manipulation | Modify chart.data.datasets[…].data directly, then call chart.update(‘none’). | Efficiently updates data points without full refresh if only data values change. |
Data Point Management for Streaming Charts: For charts displaying continuous live data (e.g., ECG monitor, live stock ticker), manage the number of displayed data points. Implement a fixed window approach: add new data points to one end and remove old ones from the other, using array methods like push() and shift() on chart.data.labels and chart.data.datasets[i].data, followed by chart.update().
Managing Firebase Connections and Data Load
- Detaching Listeners: This is critical. Firebase listeners (on() in RTDB, onSnapshot() in Firestore) maintain active connections. When a chart is not visible or its parent component unmounts, detach these listeners to prevent memory leaks, unnecessary data downloads, and background processing.
- Monitor Usage: Regularly check the Firebase console for metrics like active connections, data storage, download volume (RTDB), read/write operations (Firestore), and database load. High load or excessive data transfer can indicate performance bottlenecks.
- TLS Session Tickets (RTDB): For RTDB applications with frequent client connections/disconnections, enabling TLS session tickets can reduce SSL connection overhead for resumed connections, potentially improving connection times.
Optimizing real-time charts is holistic. It involves careful database structure, efficient data transmission, optimized client-side processing, and streamlined rendering. A bottleneck in one area can undermine optimizations elsewhere. For example, efficient Firebase queries still result in a laggy chart if Chart.js performs slow, full redraws. Conversely, an optimized Chart.js render appears sluggish if Firebase data delivery is slow due to unindexed queries or fetching large datasets. Data transformation logic can also be a bottleneck, especially on resource-constrained mobile devices. This requires a comprehensive approach to profiling and optimization.
The perceived “real-time” quality can also be impacted by client device performance, particularly on lower-end mobile hardware. Chart.js rendering, especially with animations or large datasets, can be CPU-intensive. Frequent updates, even if delivered rapidly by Firebase, can overwhelm a less powerful device’s capacity to render changes smoothly. Developers might need adaptive strategies, such as reducing update frequency, simplifying chart complexity, or using techniques like data decimation on less capable devices for a consistent user experience.
Monitoring Your Real-Time Charting Application
Continuous monitoring is necessary for the health, performance, and cost-effectiveness of real-time charting applications powered by Firebase. It enables proactive issue identification, usage pattern understanding, and informed decisions on optimization and scaling.
Why Monitor?
- Cost Management: Firebase services, particularly Firestore with its per-operation pricing, can incur significant costs if unmanaged. Monitoring tracks read/write operations, storage, and network egress, allowing early detection of high usage that might lead to budget overruns.
- Performance Troubleshooting: Monitoring database load, query latency, and connection counts helps pinpoint performance bottlenecks. High database load or slow query responses directly impact real-time chart responsiveness.
- Ensuring Reliability: Tracking error rates and service availability ensures application reliability for users.
Using the Firebase Console
The Firebase console provides built-in dashboards for a high-level overview of service usage.
- Realtime Database Usage Tab:
- Metrics: Displays key metrics such as:
- Connections: Number of simultaneous, open real-time connections (WebSocket, long polling, server-sent events; excludes RESTful requests).
- Storage: Amount of data stored.
- Downloads: Total bytes downloaded, including protocol and encryption overhead.
- Load: Percentage indicating database usage for processing requests over a 1-minute interval. Load approaching 100% indicates likely performance issues.
- Interpreting Load: Database load consistently nearing 100% strongly indicates potential performance degradation affecting real-time chart updates.
- Metrics: Displays key metrics such as:
- Cloud Firestore Usage Tab:
- Metrics: Provides insights into document reads, writes, deletes; network ingress/egress; and total storage used.
- For charting, understand how user interactions map to these metrics. Initial chart loading might cause a burst of document reads; subsequent real-time updates are driven by reads from snapshot listeners.
Monitoring “Downloads” in RTDB or “Document Reads” in Firestore, alongside the “Connections” metric, can reveal inefficient data fetching for charts. A low number of active connections with disproportionately high download or read volumes might indicate excessive data transfer by a few users, possibly due to poorly structured listeners or lack of pagination for large historical datasets. Such patterns suggest opportunities for query or data loading optimization.
Leveraging Google Cloud Monitoring for Deeper Insights
For more granular monitoring, integrate Firebase projects with Google Cloud Monitoring.
- Setup: Create a Cloud Monitoring workspace for the Firebase project if one does not exist. This organizes monitoring information.
- Key Firebase Metrics in Cloud Monitoring:
- Realtime Database: Includes metrics like network/sent_payload_bytes_count (data requested), network/sent_payload_and_protocol_bytes_count (payload + protocol), network/sent_bytes_count (total outgoing bandwidth), storage/total_bytes, and io/database_load (by operation type).
- Cloud Firestore: Includes metrics such as document_read_count, document_write_count, document_delete_count, snapshot_listeners (active listeners), and read_latency_count (distribution of read latencies).
- Custom Dashboards: Create custom dashboards in Cloud Monitoring to visualize these metrics over time, aiding in spotting trends, anomalies, or correlations (e.g., charting Firestore document reads alongside average query latency).
- Alerting Policies: Configure alerting policies for notifications (e.g., via email) when specific metrics cross predefined thresholds (e.g., high database load, sudden spike in reads, unacceptable query latency).
The “Load” metric in RTDB (Firebase console and Cloud Monitoring) is a critical health indicator. Consistently high load, even below 100%, can increase latency for all database operations, including writes ingesting new data and reads by listeners updating real-time charts. This can make the application feel sluggish and compromise the “real-time” nature of charts. High load may result from inefficient queries, computationally expensive security rules, or traffic exceeding a single RTDB instance’s capacity. Addressing this might require data sharding, data structure optimization, query refinement, or simpler security rules.
Firebase Performance Monitoring for Firestore Queries
Firebase Performance Monitoring integrated into mobile apps provides insights into specific code path performance, including Firestore queries.
- Automatic Traces: Performance Monitoring can automatically trace network request durations, including those from the Firestore SDK.
- Custom Traces: Define custom traces to measure specific operation durations, like fetching and processing data for a chart, by starting a trace before and stopping it after the operation.
- Identify Slow Queries: Analyze trace data in the Firebase console to identify slow Firestore queries contributing to long chart load times or sluggish real-time updates.
By combining these monitoring tools and techniques, developers gain a comprehensive understanding of application behavior, optimize performance, manage costs, and ensure a high-quality, responsive experience for users interacting with real-time charts.
Conclusion
Firebase and Chart.js provide a robust combination for integrating dynamic, real-time data visualizations into mobile applications. This guide detailed core technologies, framework-specific implementations, effective data modeling, performance optimization, and common troubleshooting strategies.
The expertise developed in these areas extends significantly beyond charting. Mastering real-time data stream listeners, efficient data transformation, and dynamic user interface updates equips developers to build a wide array of interactive features—from live activity feeds and collaborative tools to real-time notification systems. These capabilities are fundamental for creating applications that meet modern user demands for responsive and engaging experiences.
For ongoing analysis of application development trends and advanced techniques, follow our updates.